Intervention Studies
What are intervention studies?
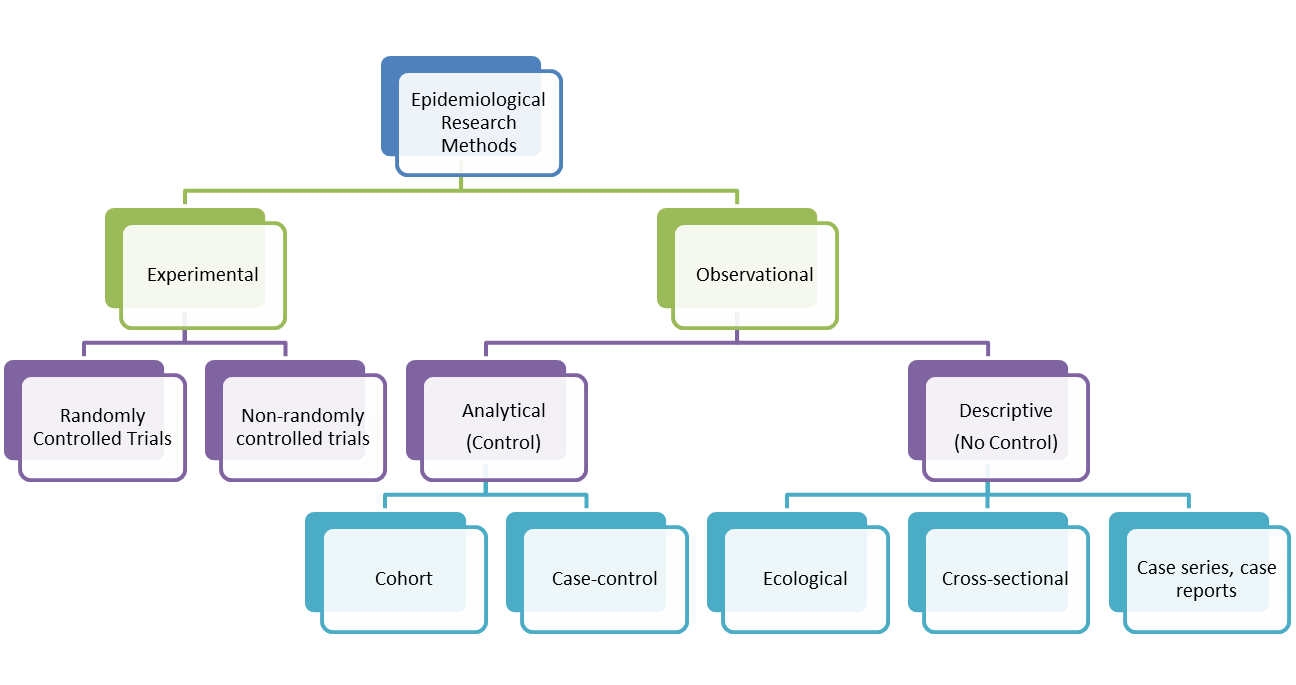
Intervention (or Experimental) studies differ from observational studies in that the investigator assigns the exposure. They are used to determine the effectiveness of an intervention or the effectiveness of a health service delivery. They can also be used to establish the safety, cost-effectiveness and accceptability of an intervention. In contrast, analytical observational studies (i.e. cohort and case control studies) look at the relationships between risk factors or characteristics of patients and their likelihood of getting a particular disease. There are two types of intervention studies: randomised controlled trials and non-randomised or quasi-experimental trials. The randomised controlled trial is considered to be the gold standard of clinical research because it is the only known way to avoid selection and confounding biases. It approximates the controlled experiment of basic science. The aim of a trial is to apply the conclusions of the experiment to people in the general population.
An important feature of Randomised Controlled Trials is randomisation. Here, participants (volunteers) are assigned to exposures purely by the play of chance (i.e. each participant has a known chance, normally an equal chance of receiving each treatment but the treatment to be received cannot be predicted). This reduces the likelihood of bias in the determination of outcomes and precludes selction bias and confounding bias. If participants and researchers are blinded as to the exposure the participant is receiving (called 'double-blinding'), information bias is also reduced. Allocation of people to treatment and control groups can be done by simple randomisation, randomisation in blocks, randomisation by strata or minimisation. Minimisation is an acceptable non-random method of group allocation in trials. It considers people who are already allocated and allocates the next patient in such a way as to keep the composition of the two groups as similar as possible with respect to certain specified factors. Determining each allocation is complex, particularly when several factors are involved. It is recommended that specialised computer software is used and that allocations are not written down in advance of the study. Despite the complexity, a recruiter can still predict the next allocation. A random element can be introduced to combat this bias.
Trial Types
- Therapeutic trials (people with disease are given treatment to prevent death or to improve health)
- Preventive trials for healthy individuals (e.g. a phase in vaccine trials to test efficacy of vaccine)
- Preventive trials for at-risk groups (used to prevent development of disease)
Both types of preventive trials are concerned with reducing risk of developing a disease
Radomised Controlled Trial Designs
- Simple or Parallel trials (the most common form)
- Factorial Trials (where there is more than two 'arms' to the trial, e.g. three different treatment groups and one control group)
- Crossover Trials (participants swap treatments half-way through; can only really work with chronic long term conditions, self-limiting diseases make it hard to measure effects.)
- Within-persons Trials (participants may be given two different treatments on two different sites of their body and so act as their own control)
- Cluster Trials (people are allocated in groups or clusters. Sometimes this is done by geographical area or health centre.
- Historical Controls Trials
- Equivalence Trials (where a new treatment or intervention is tested to see whether it is better or equivalent to the current treatment; need to be big trials in order to show statistical insignificance)
- Non-inferiority Trials (where a new treatment or intervention is tested to see whether it is non-inferior to the current gold standard)
Advantages of Randomised Controlled Trials
- Its study design eliminates confounding bias.
- If properly designed and conducted, an RCT is likely to be able to determine small to moderate effects. This is something that is difficult to establish reliably from observational studies.
Disadvantages of Randomised Controlled Trials
- They are not always ethical.
- Sample size can be too small. This wastes time and patients are included in a trial that is of no benefit to them or others. The larger the sample, the more successful the randomised procedure in removing confounding variables.
- They can be statistically significant but clincially unimportant.
- Significant tests can be misleading.
- They can be expensive.
- RCTs may not have external validity, that is, the results may not be able to be generalized to the broader community. Unlike the observational study, RCTs use volunteers. Those who volunteer tend to be different from those who do not.
Preapring your RCT design
- Systematic Review
- Protocol:
- Defining the study population, sampling, baseline data (sample size can be fixed at the start of trial or sequential, i.e. enrollment and observation continue until a stopping boundary is met).
- Choosing trial design (you may also consider doing a feasbility trial first too)
- Deciding Trial treatment and comparators
- Deciding outcomes
- Internal validity
- Practical issues - recruiting staff, centres, research ethics, insurance (who's liable if someone sues?), licensing authority, development of data collection forms, development of patient information forms, planning data management, recruiting patients, monitoring accrual and compliance, data monitoring and follow up.
Design terms
Sampling
Before trial begins, an estimate of the sample size needed should be done. This will provide a level of confidence in the hypothesis that the intervention gives benefit.
Randomisation
Randomisation removes selection bias and ensures that unknown factors that might affect the trial are, as far as possible, equally distributed between the two groups. With randomisation, everyone has an equal chance of receiving the possible treatment. If combined with blinding, it can remove bias in allocation of people to groups. Groups, in turn, are comparable with respect to all variables except the interventions being studied. It increases confidence in the results.
Stratification
Stratification is the grouping of patients according to a known characteristic affecting the outcome before randomisation to groups. This ensures equal representation of the characteristics in each group.
Placebos
Placebos are used to mask what treatment is being received. A placebo group is useful in assessing side effects and subjective treatment outcomes. Related to this is the issue of non-compliance. Non-compliance can make the difference between treatment and placebo less marked. This is usually linked to the length of the study timewise.
It is worth noting that some people argue that where an active treatment exists, it's unethical to use a placebo. A comparative trial with existing and the new drug/treament is considered better. Others disagree with this.
Intention-to-treat analysis
Intention-to-treat analysis uses patients' data according to their allocation at randomisation not according to whether they received or completed treatment. It removes bias that can arise from patients leaving trials through poor outcomes or side effects.
Interim analysis
This is an analysis of data that takes place early on in the trial. The idea is that if there are clear benefits or harm, the trial should be stopped early. There is a Haybittle Peto Stopping Rule that states to stop the trial if p<0.001 at interim analysis(this is stringent to avoid type 1 error).
Subgroup analyses
This is the investigation of possible different treatment effects in particular groups of patients. It can be A priori (prestated with good rationale so trial results can't influence which subgroups to examine) or post hoc (decided after the data has been collected and rarely anything other than hypothesis generating). Subgroup analyses are usually done because RCTs estimate the average treatment effect whilst clinicans want to know the effect in the individual patient. However, smaller numbers of participants (and events) can lead to increase in chance effects, this can mean that there are large confidence intervals for the subgroup treatment effect estimates. Caution is needed in interpreting results.
Analysis terms
Number-needed-to-treat (NNT) is a popular measure of effectiveness of interventions. An NNT is treatment-specific and describes the difference between treatment and control in achieving a particular clinical outcome. It can be used to describe any outcome where event rates are available for both treatment and control. NNT states how many patients are needed to be treated in order to prevent 1 event, which would otherwise occur. Small NNT shows considerable impact if used on commond diseases (aspirn and migraine, for instance). It is easy to understand but has no confidence interval and no adverse effects are pointed out.
Risk
Risk of an event if the probability that an event will occur within a stated time period (p). This is sometimes referred to as the absolute risk.(E.g. 1 in 20; prob = 0.5) It is calculated by dividing the number of those with the event by the total number of people in the population. Odds, by the way, is the rate of probability of an event occurring to the probability of it not occurring.
Relative Risk
This is the ratio of risk in the exposed group to the risk in the not exposed. It is possible to calculate a CI for relative risk. You can have a large relative risk (e.g. drug 20 times more likely to cause deaths than other drugs) but absolute risk may be minimum (e.g. 1.9 deaths per million participants). Relative risk estimates magnitude of an association between exposure and disease and indicates the likelihood of developing the disease in the exposed group relative to those not exposed.
Absolute or Attributable Risk
Absolute risk (AR) is risk in exposed group minus risk in unexposed or differently exposed group. This is the difference in the incidence of disease between exposed and non-exposed group. It quantifies risk attributable to exposure by removing risk of disease that would occur anyway. AR is a useful measure of public health importance of exposure. However, it is not generalisable and sometimes, it can be misinterpreted on a cause equals effect assumption, i.e. no association, then AR=0. [Please note that AR should not be used in case control studies as true incidence of risk is not known. It can be used in cohort studies.] Absolute risk can be converted to an attributable risk percent. This is an estimate of the proportion of disease attributable to exposure (or which could be eliminated). Attributable Risk Percent is calculated by dividing the attributable risk by the rate of disease among the exposed and multiplying it by 100.
Population Attributable Risk (PAR)
This is the estimate of the excess rate of disease in the total study population that is attributable to exposure. It is calculated by multiplying the attributable risk by the proportion of exposed individuals in the population. It helps determine which exposure has most relevance to a community and measures population burdern. However, it is not generalisable. PAR can also be converted to a population attributable risk, which estimates the proportion of disease in the study population attributable to exposure (and which could be eliminated if exposure was removed). It is calculated by dividing the population attributable risk by the rate of disease in the population and multiplying the result by 100.
Efficacy verus Effectiveness
|
Characteristic |
Efficacy |
Effectiveness |
|
Purpose |
Test a biological question |
Assess effectiveness |
|
Size |
<1000 |
10s of 1000s |
|
Cost |
Moderate |
Large |
|
Orientation |
Treatment |
Prevention |
|
Cohort |
Homogeneous |
Heterogeneous |
|
Data |
Complex and detailed |
Simple |
|
Focus of inference |
Internal validity |
External validity |
|
Eligibility |
Strict |
Simple |
Calculating Sample Size for RCTs
- Difference in response rates - e.g. if risk ratio is 0.88, than risk of outcome in the intervention group will be 88% of the control group percentage (e.g. 88% of 30% =26.4%)
- Response rate in 1 group
- Level of statistical significance (alpha) - usually 0.05 (5%)
- Power desired (1-beta) - usually at least 80%
- 1 sided or 2 sided - ratio of sample sizes in two treatment groups is usually 1:1
- For cluster RCTs, you need to estimate cluster size and intra-cluster co-efficient (ICC). This is because patients within the same cluster maybe more similar to each other than patients from different clusters (think intra- and inter-cluster variations). You need to allow for this similarity when analyzing the data. It also affects the sample size required to achieve given power. ICC has a value between 0 and 1, where 0=two patients from the same cluster are no more similar than two patients from different clusters and 1=two patients from the same cluster have identical outcomes. Sample size for cluster RCTs is determined by multiplying the required sample size by the design effect where design effect= 1 +[(k-1)X ICC]. (k=nos of patients per cluster).
Effect of Outcomes on Sample Size and Power in RCTs
Continuous Outcome (e.g. as measured by a t-test):
You need to consider the mean difference between treatment groups which you would like to be able to detect and an estimate of the standard deviation within either group
Binary Outcome (measured by chi-squared test):
You need to consider proportion with a good outcome under the experimental treatment and proportion with a good outcome under the control treatment
Further reading
Schultz, K.F.& Grimes, D.A. (2002) "Sample Size slippages in randomised trials: exclusions and the lost and wayward." The Lancet, 359, 781-85.
Schultz, K.F.& Grimes, D.A. (2002) "Unequal group sizes in randomised trials: guarding against guessing." The Lancet, 359, 966-70.
Schultz, K.F.& Grimes, D.A. (2002) "Blinding in randomised trials: hiding who got what." The Lancet, 359, 696-700.
Schultz, K.F.& Grimes, D.A. (2002) "Generation of allocation sequences in randomised trials: chance not choice." The Lancet, 359, 515-19.
Schultz, K.F.& Grimes, D.A. (2002) "Allocation concealment in randomised trials: defending against deciphering." The Lancet, 359, 614-18.